Vision Score Dashboard
What it's for
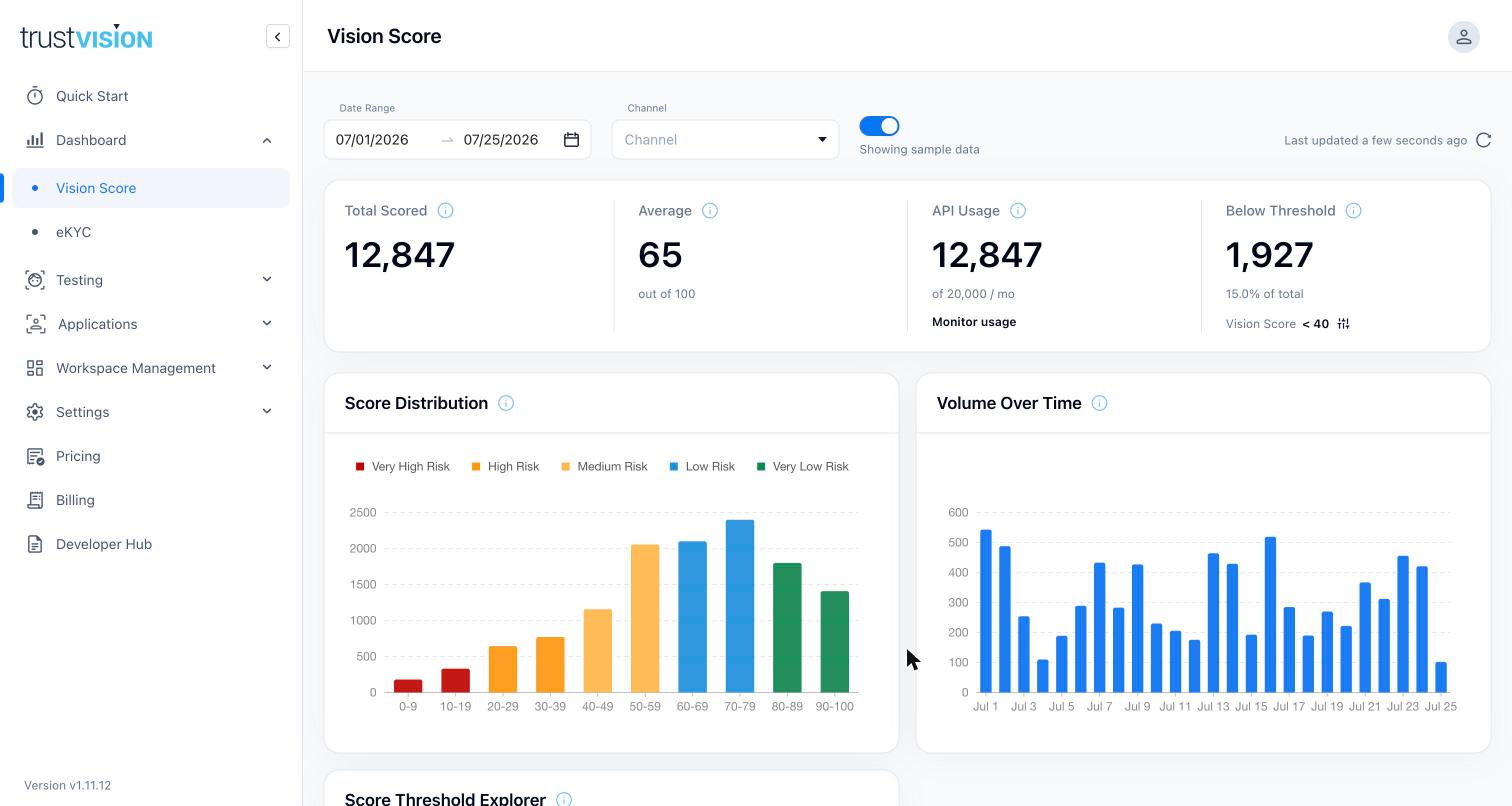
The Vision Score Dashboard is where you monitor how the AI risk score is performing across your live traffic — volume, score distribution, and how many applicants are landing above or below your risk thresholds. Use it to sanity-check that scoring is running as expected, and to understand what share of your portfolio would be affected if you moved a threshold.
What you can see
Summary metrics (for the selected date range and channel — filter by both to compare lending pathways rather than reading blended numbers):
- Total Scored — number of selfies scored in the period. A drop to near-zero for a channel is usually an integration issue on your side, not a scoring issue — check with your technical team before assuming a model problem.
- Average — mean Vision Score across the period, out of 100.
- API Usage — calls consumed this period against your monthly plan quota. Watch this against your plan's included quota (see Billing & Plans) to avoid unplanned overage charges.
- Below Threshold — count of applicants scoring below your configured cutoff (default cutoff shown is Vision Score < 40; adjustable).
Score Distribution — a chart showing how scored applicants are spread across the 0–100 range, so you can see at a glance whether your portfolio is skewing toward low-risk or high-risk.
Volume Over Time — scoring volume trended across the selected date range, useful for spotting traffic spikes, drop-offs, or integration issues.
Recent Applications — a live feed of the most recent scored applications (Application ID, time, score), with a link through to the full Applications list for deeper review.
Related areas
- To validate Vision Score against your own historical portfolio (not just live traffic), see Backtesting & Fine-Tuning.
- To change what score threshold triggers rejection for a given lending pathway, see Channels.
- To review why one specific applicant scored the way they did, see Applications.