Monitoring overview
The Overview page under Transaction Monitoring is the operational dashboard for detection. It answers three questions at a glance: how much are we screening, what is being flagged and by which rules, and is the pipeline healthy and fast enough.
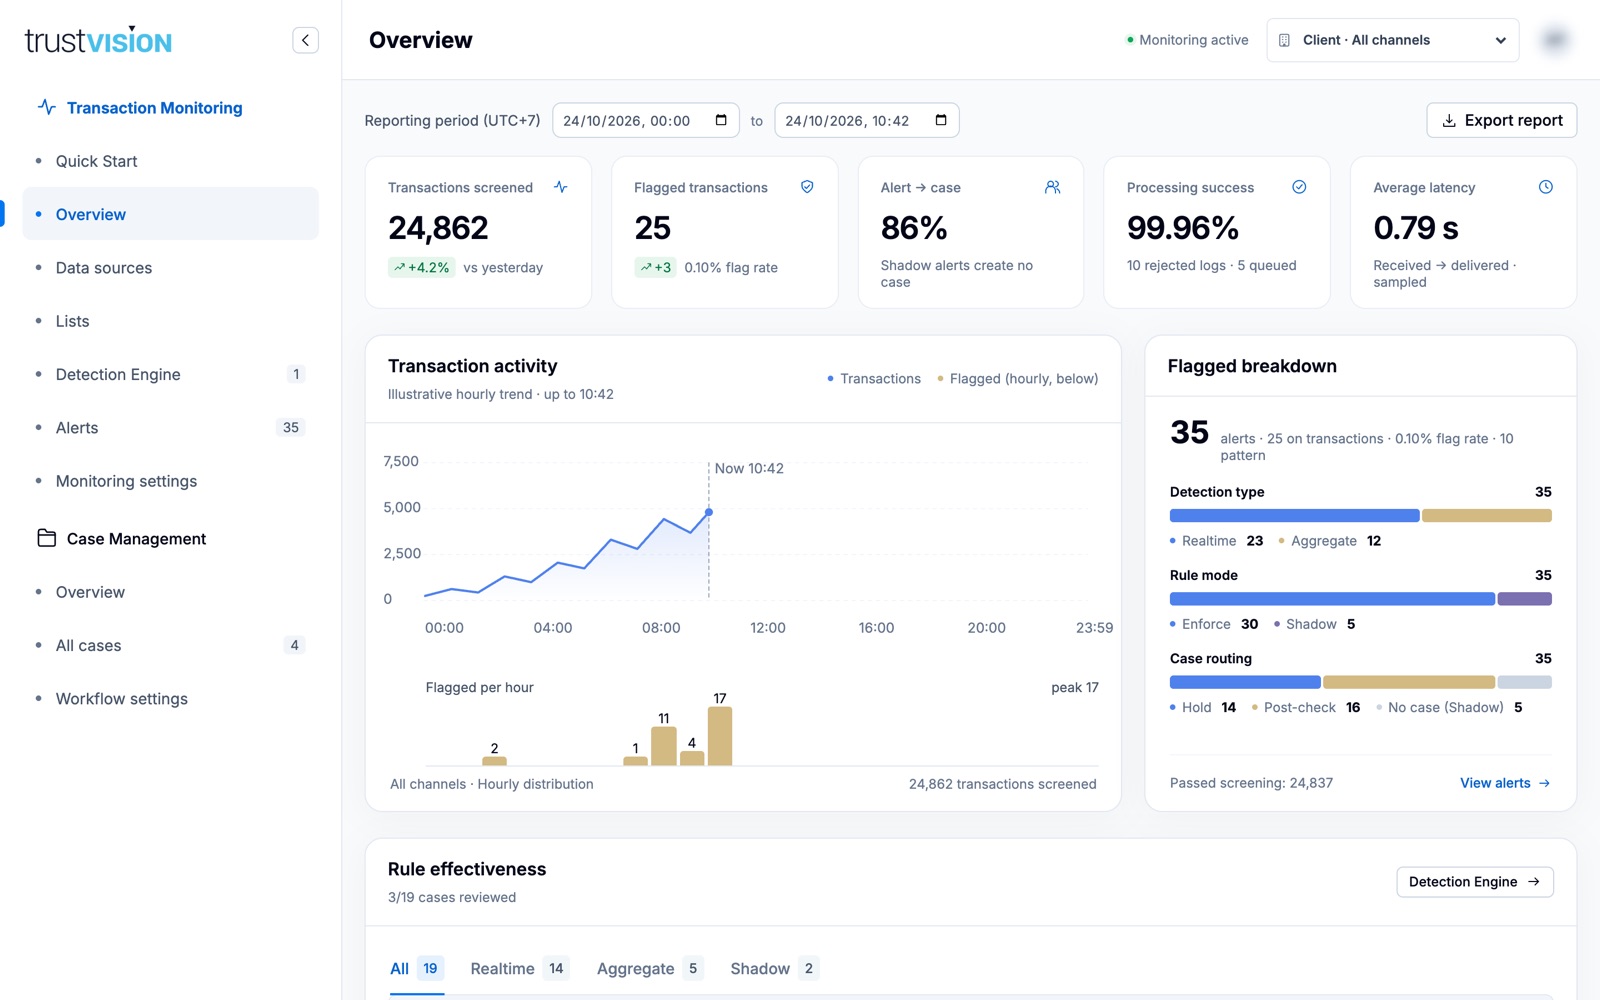
Reporting period
Use Reporting period (UTC+7) at the top to choose the start and end time. All widgets follow the period and the scope selected in the header. Export report downloads the current view.
What you can see
KPI cards
- Transactions screened — events evaluated in the period, with change vs. yesterday.
- Flagged transactions — transactions that matched at least one rule, and the flag rate.
- Alert → case — share of alerts that became a case. Shadow alerts never create cases, so they lower this ratio by design.
- Processing success — share of received logs processed successfully, with rejected and queued counts.
- Average latency — time from receiving an event to delivering the result.
Detection
- Transaction activity — hourly volume trend with flagged transactions per hour underneath.
- Flagged breakdown — alerts split by detection type (Realtime / Aggregate), rule mode (Enforce / Shadow) and case routing (Hold / Post-check / No case). Click View alerts to open the list.
- Rule effectiveness — per-rule hits, 7-day trend, and hit rate. Filter with the All / Realtime / Aggregate / Shadow tabs. Click Alerts → on a row to see that rule's alerts.
Data and entities
- Alerts by data source — how many alerts each source contributed and how many of its fields rules use.
- Top alerted entities — the customers, channels, devices or IPs behind the most alerts.
- Alerts by hour and channel — heatmap of when alerts happen; the peak hour is called out below.
Platform health
- Pipeline health — status of each stage: Log ingestion → Processing queue → Detection Engine → Result delivery. A Degraded delivery stage usually means failed webhooks (see Failed webhooks).
- End-to-end latency — AVG, P90 and P99 of the time from receiving an event to delivering the result.
Review Rule effectiveness weekly. A rule with many hits but few true positives is a tuning candidate. If most alerts of a rule come from one customer (check Top alerted entities), handle that customer with a list entry rather than a broader rule change.
Related areas
- To drill into individual detections, see Alerts.
- To tune the rules you see here, see Detection rules.